한국의 토지개혁
제24군단 사령부 경제고문관실
존경하는 국무장관 귀하
본인은 남한의 토지소유권에 관한 추가정보를 제출하게 돼 영광입니다. 현재 고려중인 토지개혁안이 남한의 토지소유권 형태에 영향을 끼칠 것입니다.
이 급송문서에 포함된 정보는 ‘한국의 토지개혁’이라는 제목으로 1947년 9월 12일자 서울의 정치고문관 <급송문서> 제77호에 포함된 같은 제목의 정보를 보충하고 있습니다.
1. 현 남한의 농지소유권 상황
남조선과도정부 농무부는 최근 1946년 12월 31일 현재 남한의 농지 소유상황과 농지규모에 관한 조사를 완료했습니다. 조사 결과 전쟁 말기와 1946년 12월 31일 사이의 농지임차가 현저하게 감소했다는 것이 드러났습니다.
그러나 1946년 12월 31일 현재 남한의 213만 7,288농가 가운데 43%는 자신들이 농사를 짓는 모든 농지를 임대하고 있고 38%는 자신들의 토지 가운데 일부 소유 일부 임대하고 있으며 16%만이 자작하는 농지를 소유한 것으로 나타났습니다.
표1은 1943년 12월 현재(일본의 항복전 최신 자료) 소유권별 농가수를 담고 있습니다. 자신들이 경작하는 모든 농지를 임대한 가구비율이 1943년의 51%에서 1946년에는 43%로 감소한 것은 주로 다음과 같은 요인들에 근거한 것으로 설명됩니다.
⒜ 1945년 10월 시행된 농지의 법적 임차료 삭감은 주요 작물의 3분의 1을 임대료로 정함에 따라 지주들의 농지소득을 급감시켰고 따라서 대체적으로 지주들이 자신들의 토지를 소작인들에게 더욱 팔도록 만들었습니다.
⒝ 종전 이후 토지개혁 문제가 활발하게 논의돼 남한에서 어떤 형태든지 간에 토지개혁이 실시되는 것은 시간문제일 것으로 간주됐습니다.
이러한 요인들은 1946년 3월 북한의 지주 토지에 대한 무상몰수와 관련되면서 다른 물가에 비하여 낮은 농지가를 유지하는 요소로 작용했고 최대 소작료 감축의 혜택으로 경제적 지위가 상승된 많은 소작농들로 하여금 자신들이 경작하는 농지를 매입할 수 있도록 했습니다. 1947년의 통계는 아직 나와 있지 않지만 1946년에 나타났던 지주들의 소작인들에 대한 농지판매와 같은 추세가 1947년에도 계속됐다는 것은 의심의 여지가 없습니다.
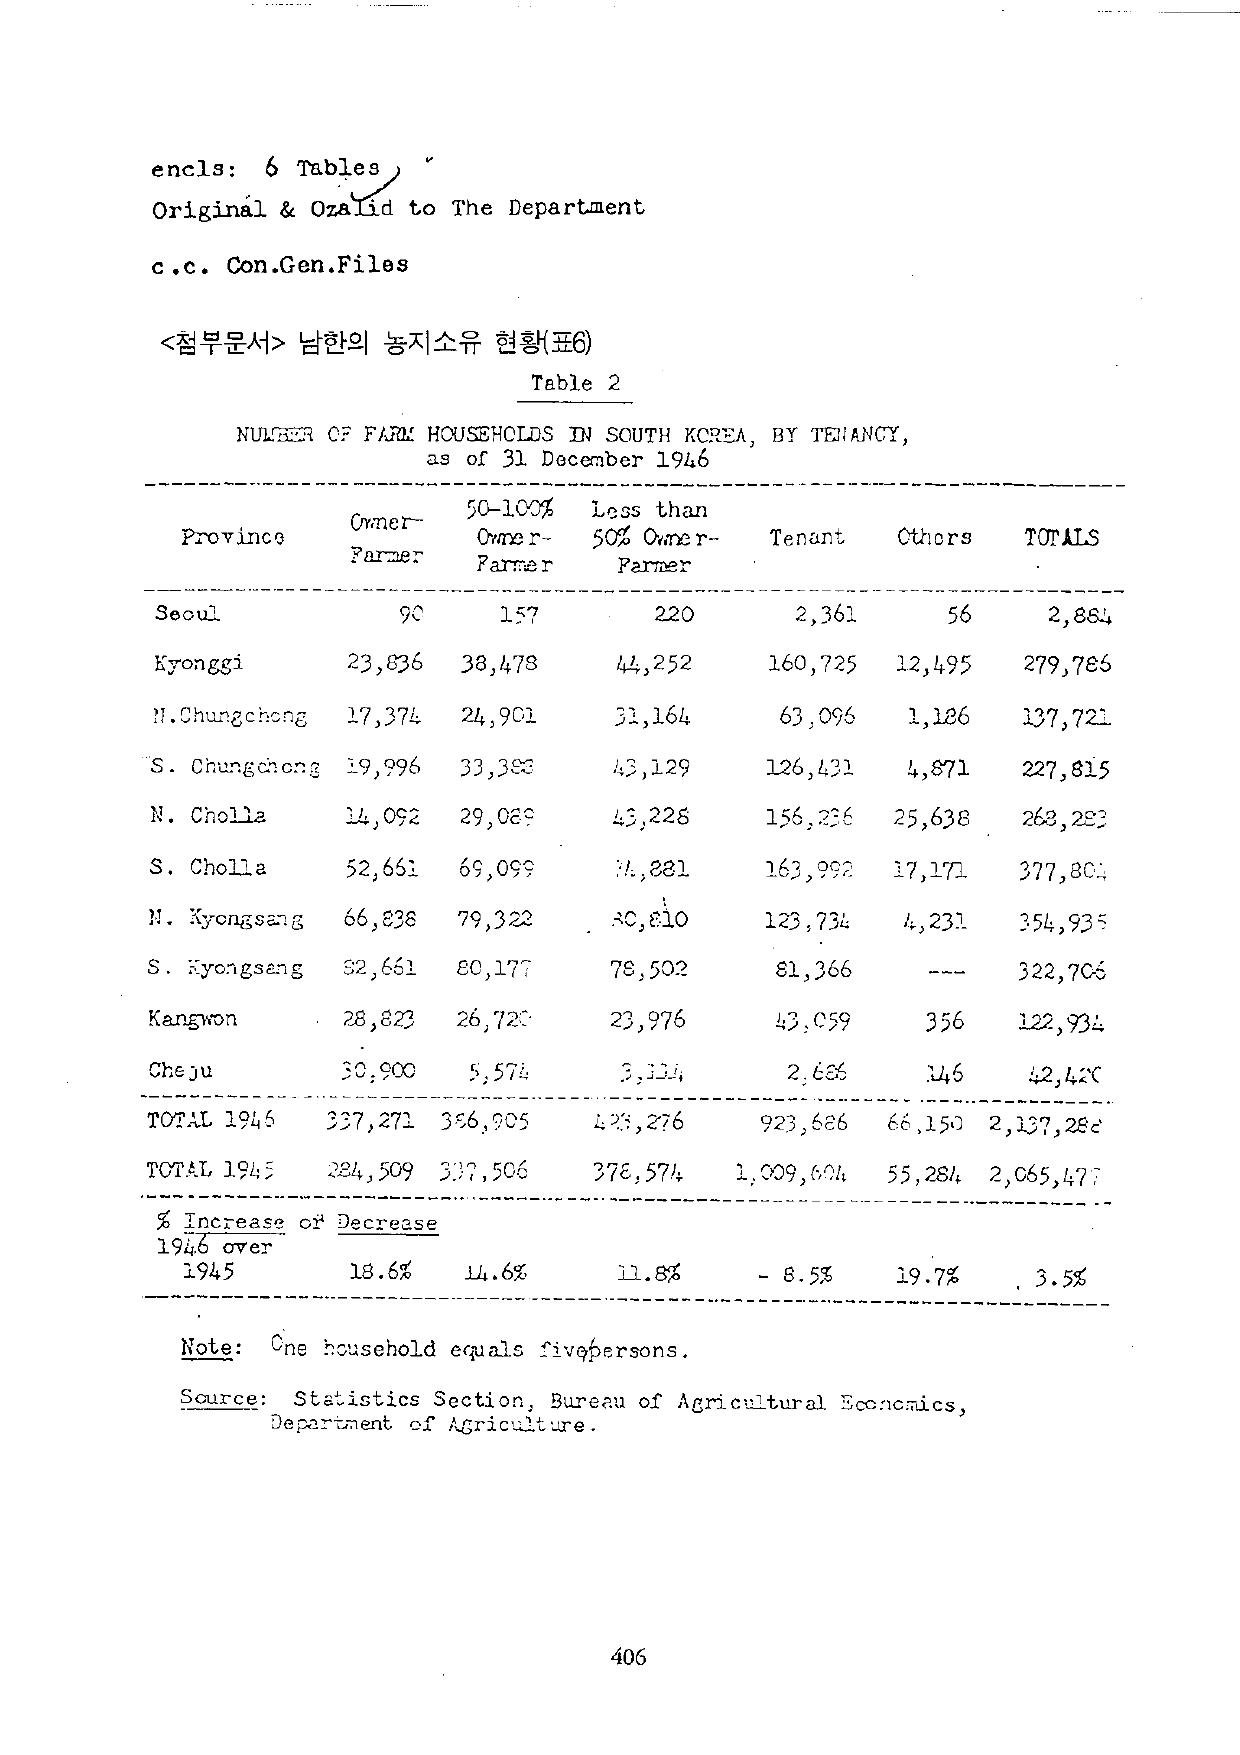
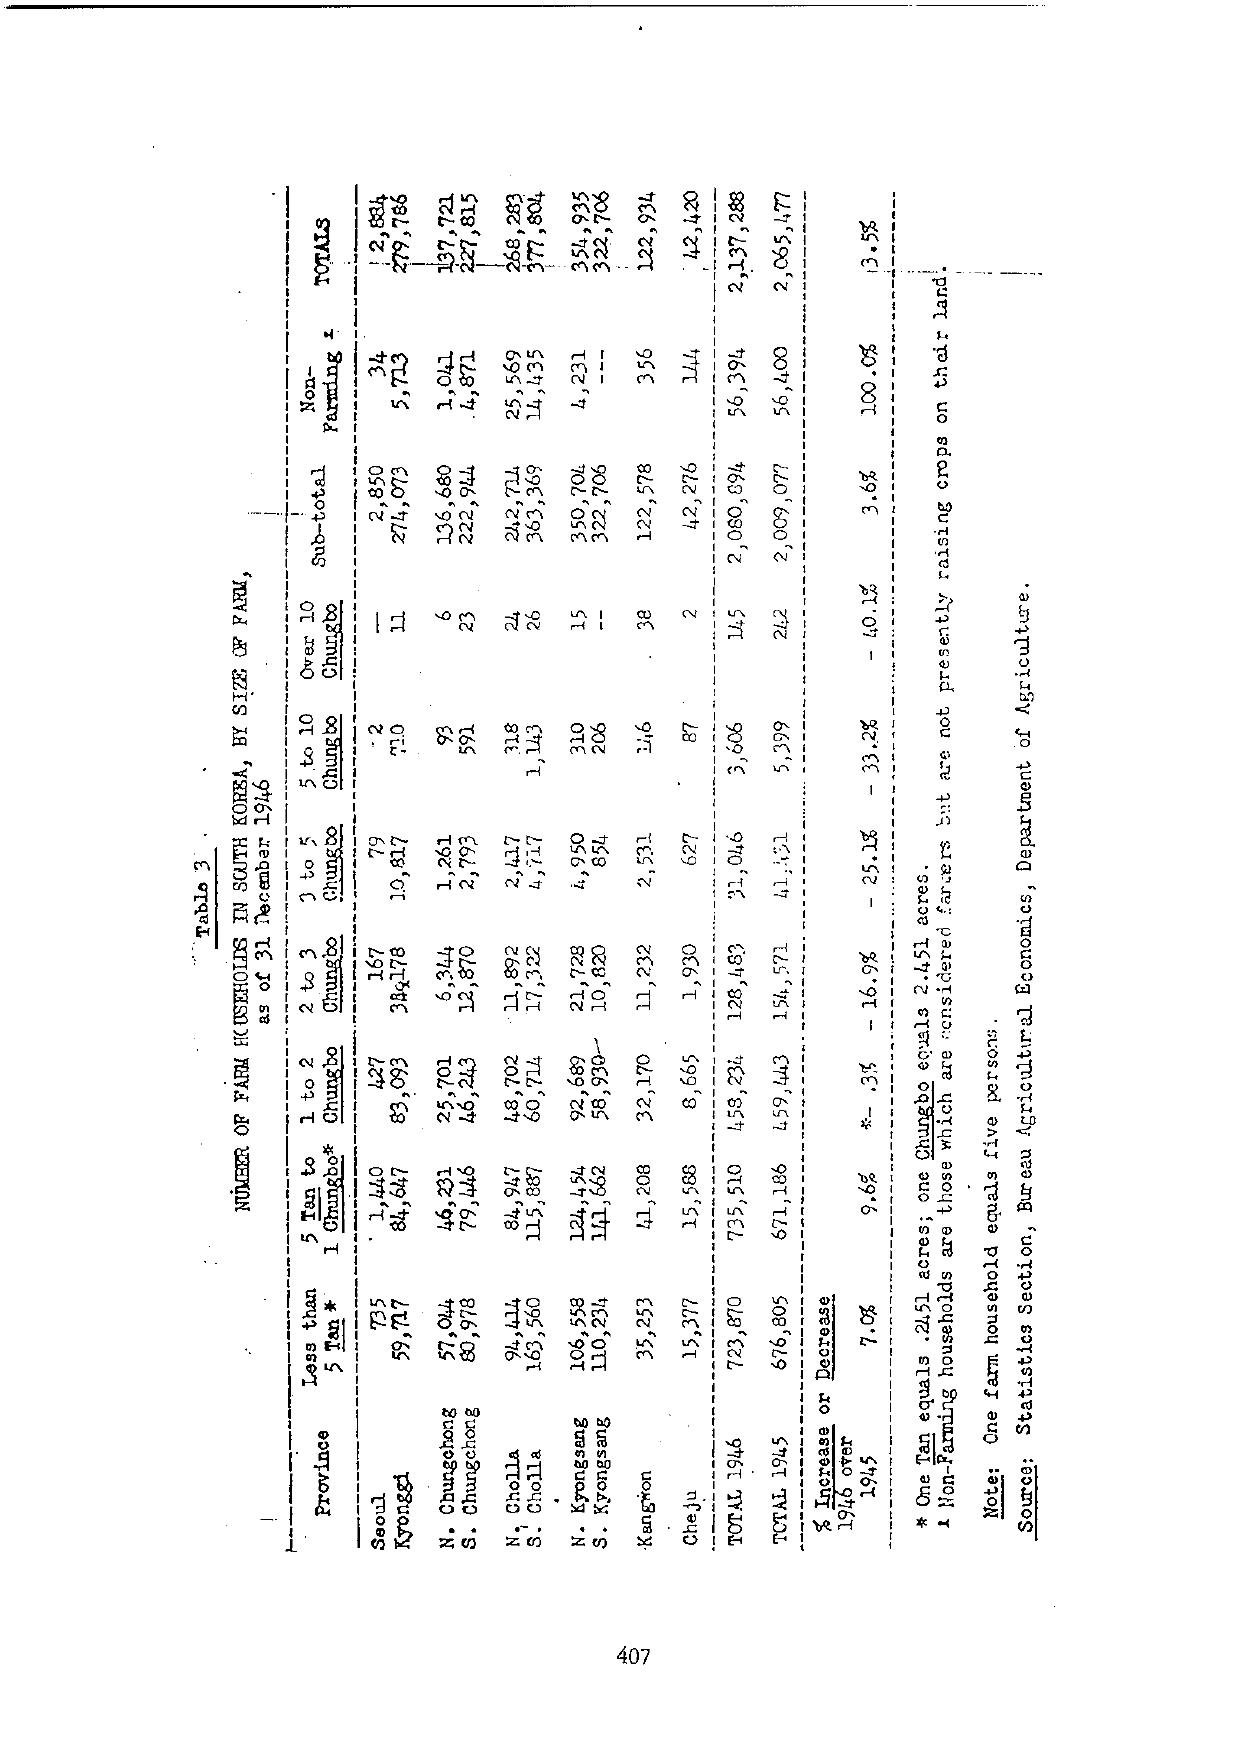
표2는 1946년 현재 토지소유별, 도별 남한의 농가수입니다. 1946년 12월 31일 현재 농지규모별 농가수를 보여준 표3은 대규모 농지가 소규모 농지로 분할되고 매우 작은 규모의 농지수가 현저히 증가하는 추세를 보여줍니다.
이렇게 해서 24.5에이커 이상의 농지수가 1946년 1년 동안에 40.1% 줄었습니다. 12.5~25에이커 규모의 농지수는 33.2%, 7.4~12.5에이커 규모의 농지수는 25.9%, 4.9~7.4에이커 규모의 농지수는 16.9% 줄었습니다.
같은 기간에 1.22~2.451에이커 규모의 농지수가 9.6% 증가했고, 1.22에이커 미만의 농지수는 7% 증가했습니다.
이런 변화는 대개 일본과 중국으로부터 200만 명 이상의 귀환자와 1945년 후반과 1946년에 북한에서 피난민들이 유입돼 토지에 대해 압력이 점점 증대되어 나타난 결과입니다.
현재 남한의 농장크기가 평균 약 2.7에이커밖에 안 되는데 이처럼 농장규모가 축소되는 추세는 비경작자에 대한 배급용으로 정부에 판매할 수 있는 농업생산량의 비율을 떨어뜨리는 경향이 있습니다. 이렇게 해서 식량문제가 두드러졌습니다.
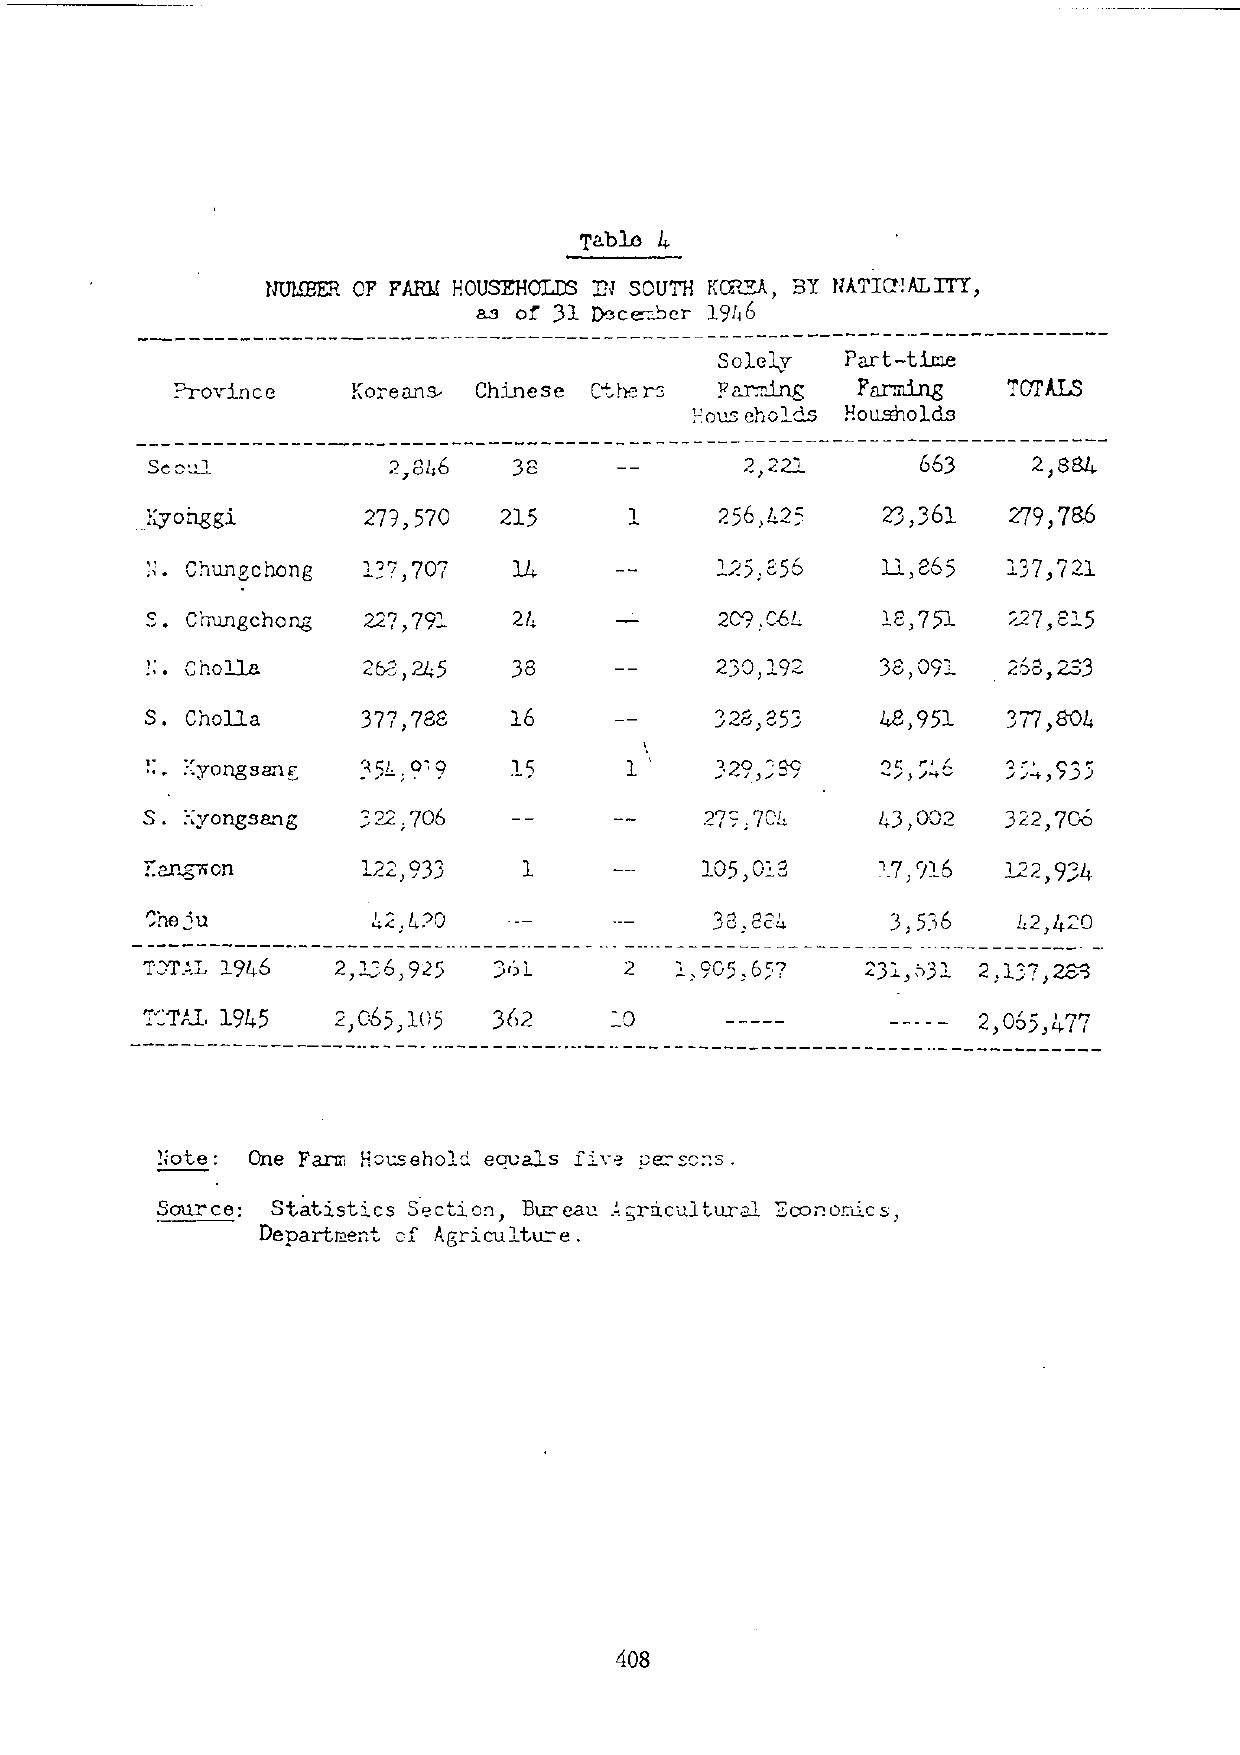
표4는 1946년 12월 31일 현재 남한의 213만 6,925 농가 가운데 363농가만이 외국인임을 가리키고 있습니다. 전체 농가의 89% 이상이 전업농으로서 농사를 짓고 있는 것으로 보고됐습니다.
전업농이 아닌 23만 1,631농가 대부분도 농가소득을 보충하기 위해 어업에 종사하고 있습니다.
2. 현재 고려중인 토지개혁안이 남한의 토지소유 형태에 끼친 잠재적인 영향
남조선과도입법부가 농업, 산업, 노동위원회의 심의와 승인을 위해 현재 상정된 토지개혁안을 통과시킨다면 남한 농민의 약 90%가 법안 통과 뒤 1년 이내에 자신들이 경작하는 토지에 대한 소유권을 가질 것으로 예상됩니다.
이 법안은 소작농들로 하여금 15년 동안 연간 생산량의 20%를 지불해 부재지주로부터 현재 경작하는 농지를 매입할 수 있도록 할 것입니다.
그러나 입법의원내에 강력한 우익진영이 정부수립 때까지 법안심의를 보류하려고 하기 때문에 현재의 입법의원이 일본인들이 소유했던 농지와 한국인들이 소유한 농지 처리를 담고 있는 토지개혁법안을 승인할 것 같지는 않습니다.
현재 입법의원이 일본인들이 소유했던 농지와 한국인 소유 농지의 처리문제를 담고 있는 토지개혁법안을 승인하지 않는다면 귀속된 일본인들이 소유했던 농지는 입법의원의 승인이나 행정부의 포고령으로 1948년 봄에 소작농들에게 매각 할 것으로 계획하고 있습니다.
토지개혁 방안의 진전상황에 관한 정기보고서는 무선으로 계속해서 국무부에 보낼 예정입니다.
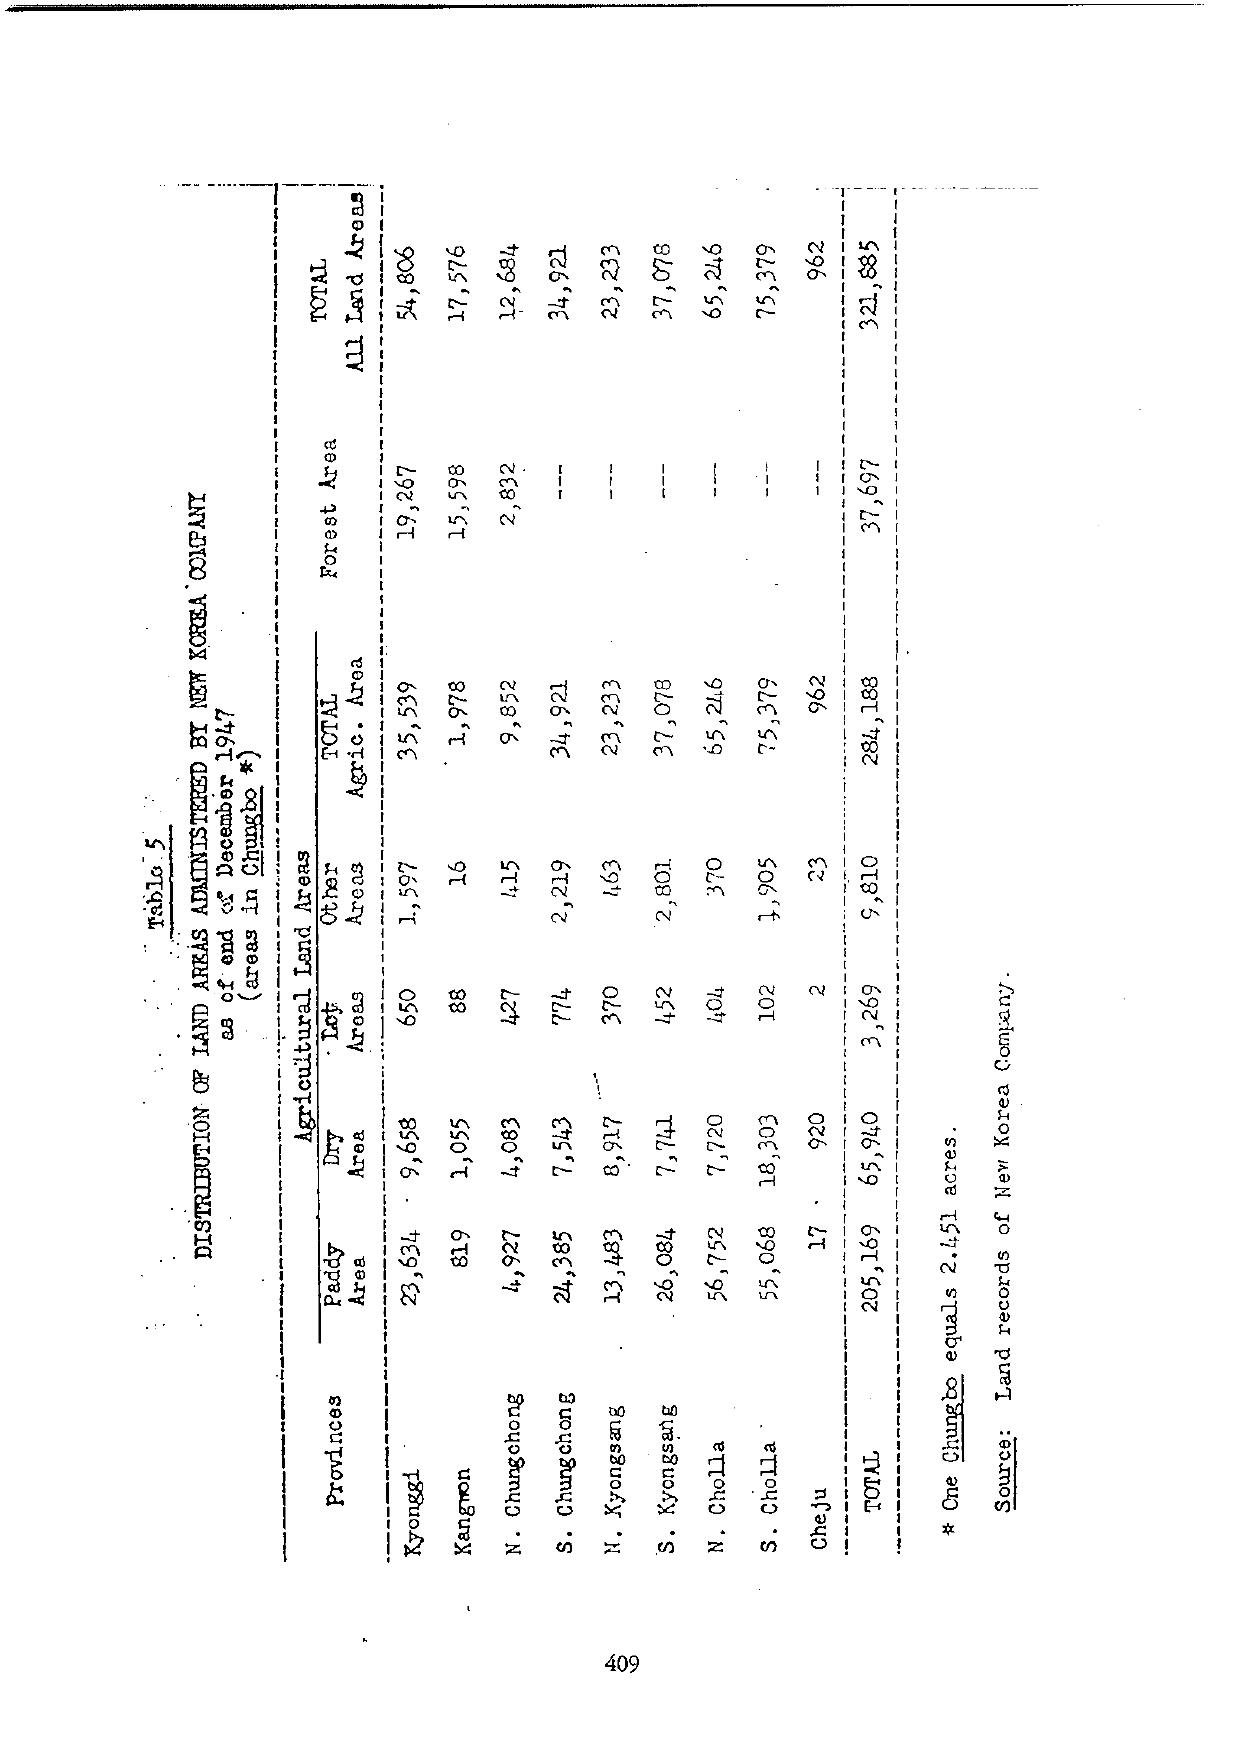
표5, 6은 전 일본인들이 소유했던 농지를 관리하기 위해 군정장관이 지정한 신한공사의 현 농지소유를 보여주고 있습니다. 표5에서 보여주듯이 1947년 12월 현재 신한공사가 관리하는 전체 농지는 69만 6,545에이커(28만 4,188정보)입니다. 이것은 남한에서 알려진 전 일본인들이 소유했던 농지의 90% 이상을 나타냅니다. 즉 여러 다른 정부기관들은 여전히 소규모 적산 농지를 관리하고 있습니다.
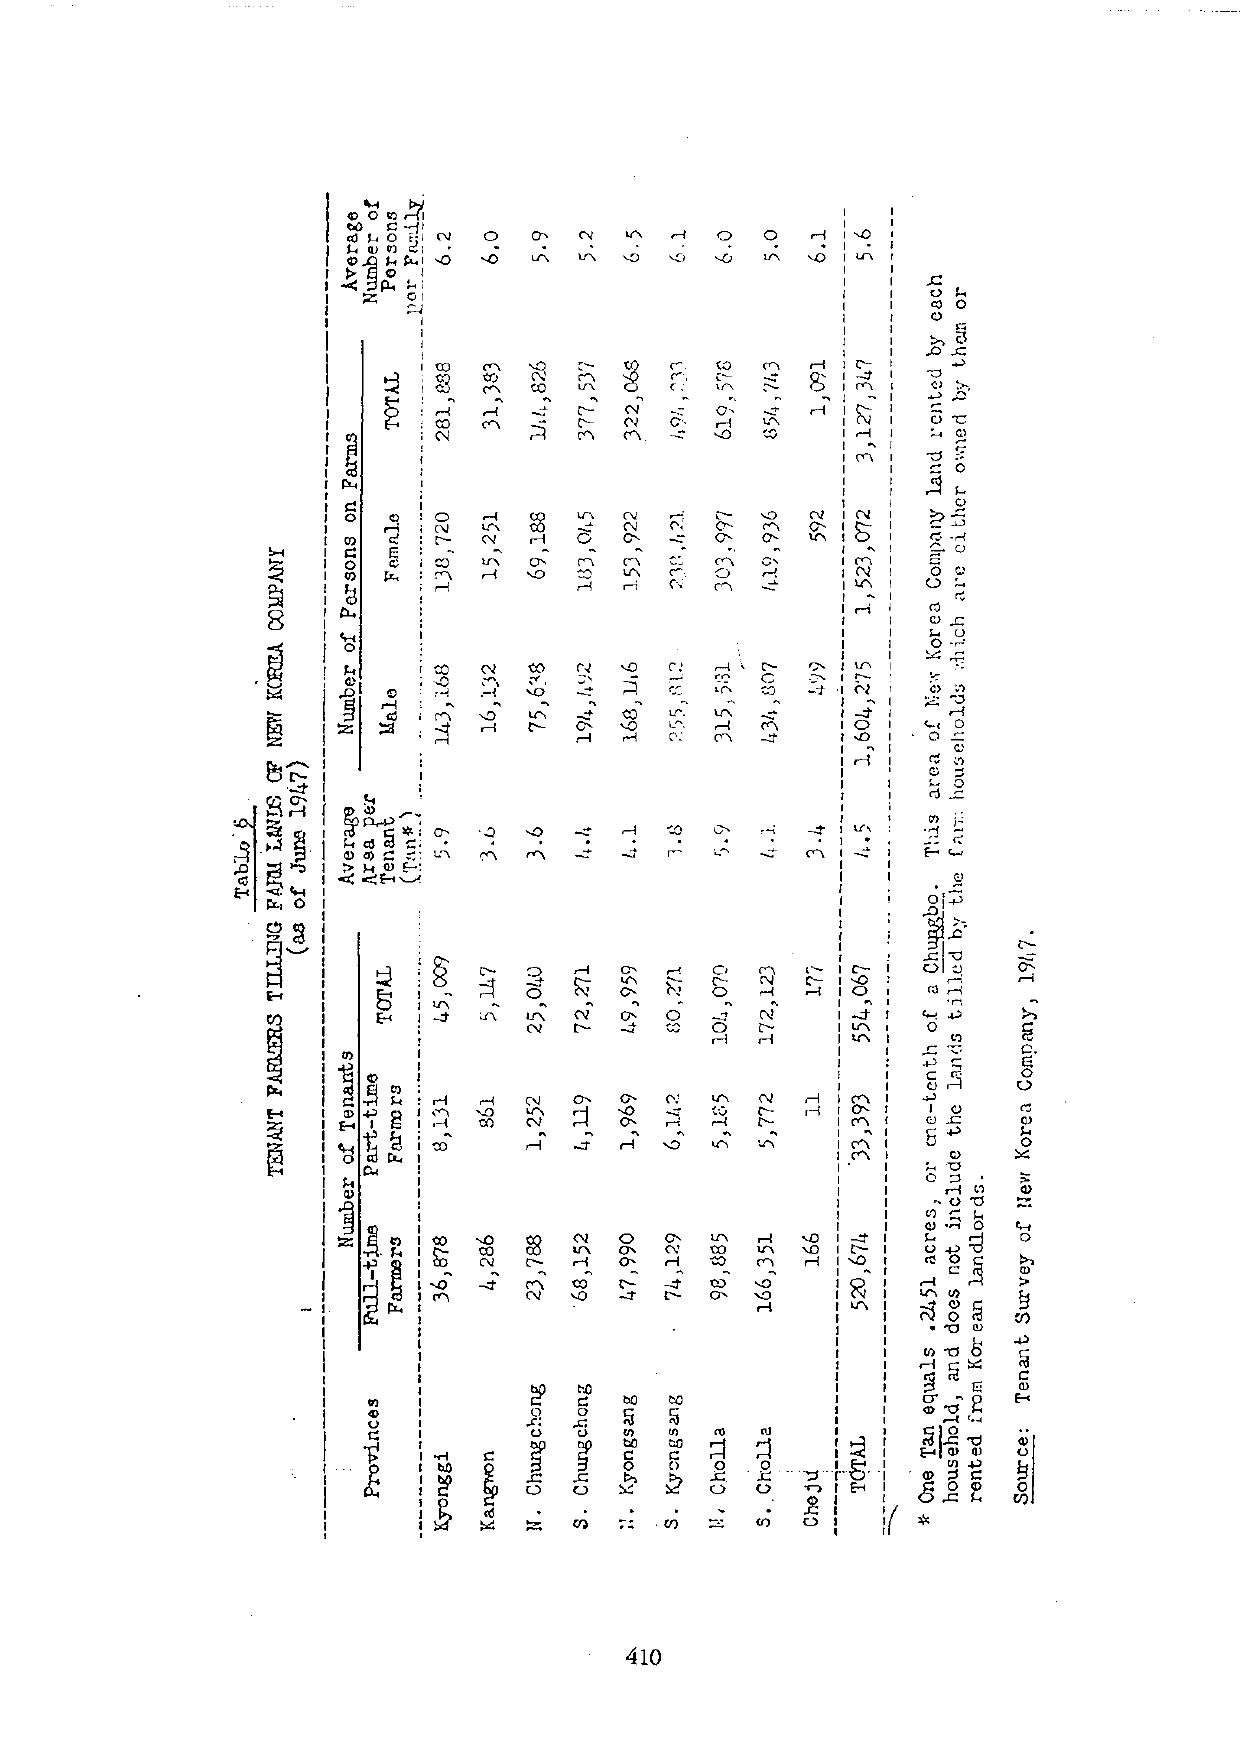
표6은 1947년 6월 현재 신한공사로부터 농지를 임차하고 있는 농가수가 55만 4,067농가이며 이 가운데 3만 3,393농가는 겸업농임을 보여줍니다. 이와 함께 농가당 임차된 신한공사의 평균 면적은 1.1에이커(4.5단보 또는 0.45정보)밖에 안됩니다.
이 일본인들이 소유했던 토지는 남한 최고의 미곡지대를 포함하고 있습니다. 이 토지가 평균 농지규모 이하라도 많은 신한공사의 소작농들은 추가농지를 한국인 지주들로부터 임차하거나 자신들이 임차한 농지에 추가해 작은 땅뙈기를 임차합니다.
1947년 현재 토지를 관리하는 신한공사에 의지해 먹고 사는 전체 인구수는 남한 총인구의 약 15%인 312만 7,347명입니다. 만일 신한공사가 공사의 토지를 경작하는 소작농들에게 좋은 조건으로 토지를 매입할 기회를 부여한다면 한국인 소유토지를 경작하는 소작농들도 같은 조건으로 농지를 매입할 기회를 얻기 위하여 세찬 압력을 행사할 것입니다.
외교사절 아더 번스(Arthur C. Bunce)
<첨부문서> 남한의 농지소유 현황
(표2에서 표6까지 모두 5개만 도식함)
표2. 1946년 12월 31일 현재 남한의 임차별 농가수
도 별
자작농
50%이상
자작농
50%미만
자작농
소작농
기타
합계
서 울
90
157
220
2,361
56
2,884
경 기
23,836
38,478
44,252
160,725
12,495
279,786
충 북
17,374
24,901
31,164
63,096
1,186
137,721
충 남
19,996
33,388
43,129
126,431
4,871
227,815
전 북
14,092
29,089
43,228
156,236
25,638
268,283
전 남
52,661
69,099
74,881
163,992
17,171
377,804
경 북
66,838
79,322
80,810
123,734
4,231
354,935
경 남
82,661
80,177
78,502
81,366
-
322,706
강 원
28,823
26,720
23,976
43,059
356
122,934
제 주
30,900
5,574
3,114
2,686
146
42,420
1946년총계
337,271
386,905
423,276
923,686
66,150
2,137,288
1945년총계
284,509
337,506
378,574
1,009,604
55,284
2,065,477
증감율(%)
18.6
14.6
11.8
-8.5
19.7
3.5
주: 1가구는 5인 가족
출처: 농무부 농업경제국 통계과
표3. 1946년 12월 31일 현재 남한의 농지규모별 농가수
도별
5단
이하*
5단~
1정보*
1~2
정보
2~3
정보
3~5
정보
5~10
정보
10정보
이상
합계
비농가
1/
총계
서울
735
1,440
427
167
79
2
-
2,850
34
2,884
경기
59,717
84,647
83,093
34,178
10,817
710
11
274,073
5,713
279,786
충북
57,044
46,231
25,701
6,344
1,261
93
6
136,680
1,041
137,721
충남
80,978
79,446
46,243
12,870
2,793
591
23
222,944
4,871
227,815
전북
94,414
84,947
48,702
11,892
2,417
318
24
242,714
25,569
268,283
전남
163,560
115,887
60,714
17,322
4,717
1,143
26
363,369
14,435
377,804
경북
106,558
124,454
92,689
21,728
4,950
310
15
350,704
4,231
354,935
경남
110,234
141,662
58,930
10,820
854
206
-
322,706
-
322,706
강원
35,253
41,208
32,170
11,232
2,531
146
38
122,578
356
122,934
도별
5단
이하*
5단~
1정보*
1~2
정보
2~3
정보
3~5
정보
5~10
정보
10정보
이상
합계
비농가
1/
총계
제주
15,377
15,588
8,665
1,930
627
87
2
42,276
144
42,420
1946년 합계
723,870
735,510
458,234
128,483
31,046
3,606
145
2,080,894
56,394
2,137,288
1945년 합계
676,805
671,186
459,443
154,571
41,431
5,399
242
2,009,007
56,400
2,065,477
증감율
7.0%
9.6%
-0.3%
-16.9%
-25.1%
-33.2%
-40.1%
3.6%
100.0%
3.5%
* 1단은 0.2451에이커, 1정보는 2.451에이커와 같다.
1/ 비농가는 농민으로 간주되지만 현재 작물을 재배하지 않는 사람들이다.
출처: 농무부 농업경제국 통계과
표4. 1946년 12월 31일 현재 국적별 농가수
도별
한국인
중국인
기타
전업농가
반전업농가
합계
서울
2,846
38
-
2,221
663
2,884
경기
279,570
215
1
256,425
23,361
279,786
충북
137,707
14
-
125,856
11,865
137,721
충남
227,791
24
-
209,064
18,751
227,815
전북
268,245
38
-
230,192
38,091
268,283
전남
377,788
16
-
328,853
48,951
377,804
경북
354,919
15
1
329,389
25,546
354,935
경남
322,706
-
-
279,704
43,002
322,706
강원
122,933
1
-
105,018
17,916
122,934
제주
42,420
-
-
38,884
3,536
42,420
1946년
합계
2,136,925
361
2
1,905,657
231,631
2,137,288
1945년 합계
2,065,105
362
10
-
-
2,065,477
주: 1농가 5인 가족 기준
출처: 농무무 농업경제국 통계과
표5. 1947년 12월 현재 신한공사가 관리하는 토지 분배(단위: 정보)
도별
농업토지면적
산림면적
총면적
답
전
지구
기타
합계
경기
23,634
9,658
650
1,597
35,539
19,267
54,806
강원
819
1,055
88
16
1,978
15,598
17,576
충북
4,927
4,083
427
415
9,852
2,832
12,684
충남
24,385
7,543
774
2,219
34,921
-
34,921
경북
13,483
8,917
370
463
23,233
-
23,233
경남
26,084
7,741
452
2,801
37,078
-
37,078
전북
56,752
7,720
404
370
65,246
-
65,246
전남
55,068
18,303
102
1,905
75,379
-
75,379
제주
17
920
2
23
962
-
962
총계
205,169
65,940
3,269
9,810
284,188
37,697
321,885
*1정보는 2.451에이커와 같다.
출처: 신한공사 토지기록
표6. 신한공사의 농지를 경작하는 소작농(1947년 6월 현재)
도별
소작인수
소작평균
면적(단*)
농민수
가족당
평균수
전업농
겸업농
합계
남자
여자
합계
경기
36,878
8,131
45,009
5.9
143,168
138,720
281,888
6.2
강원
4,286
861
5,147
3.6
16,132
15,251
31,383
6.0
충북
23,788
1,252
25,040
3.6
75,638
69,188
144,826
5.9
충남
68,152
4,119
72,271
4.4
194,492
183,045
377,537
5.2
경북
47,990
1,969
49,959
4.1
168,146
153,922
322,068
6.5
경남
74,129
6,142
80,271
3.8
255,812
238,421
494,233
6.1
전북
98,885
5,185
104,070
5.9
315,581
303,997
619,578
6.0
전남
166,351
5,772
172,123
4.1
434,807
419,936
854,743
5.0
제주
166
11
177
3.4
499
592
1,091
6.1
총계
520,674
33,393
554,067
4.5
1,604,275
1,523,072
3,127,347
5.6
*1단은 0.2451에이커 또는 10분의 1 정보와 같다. 각 가구가 임차한 이 신한공사 토지면적은 농가가 소유하거 나 한국인 지주로부터 임차한 농가가 경작하는 토지를 포함하지 않는다. 출처: 1947년 신한공사 소작조사
No. 39
THE FOREIGN SERVICE
OF THE
UNITED STATES OF AMERICA
DIVISION OF
NORTHEAST ASIAN AFFAIRS
RESTRICTED
MAR 1 9 194[illegible]
DIVIS'N OF OCCUPATION AFFAIRS
EO OVIC AFFAIRS
DEPARTMENT OF STATE
MAR 9 1948 Office of Economic Adviser
[illegible] STAFF Eq. XXIV Corps
DEPARTMENT OF APO 235, c/o PM San Francisco.
3-/6 [illegible]/Seoul, Korea, 23 February 1948.
SUBJECT: Land Reform in Korea
THE HONORABLE
MAR 23 1948
THE SECRETARY OF STATE,
WASHINGTON.
SIR:
I have the honor to present additional information concerning land tenure in South Korea and the effect of land reform proposals now under consideration may have on the pattern of land ownership in the American occupied zone in Korea. The information included in this despatch supplements other information on the same subject included in Seoul Polad despatch No.77 of 12 September 1947, entitled "Land Reform in Korea".
I – Present Status of Farm Land Ownership in South Korea: 0 é 1E LE A.S orb75. 5 2/9-n47 y6s, 24s
The Department of Agriculture of the South Korea Interim 895 Government recently completed a survey of the status of farm land ownership and the size of farms in South Korea as of 31 December 1946. This survey revealed that there was a significant decline in farm tenancy between the end of the war and 31 December 1946. However, as of the latter date, of the 2,137,288 farm households in South Korea, 43% rented all the land they tilled, 38% owned part and rented part of their land, and only 16% owned all the land they cultivated. Table I includes the number of farm households, by categories of ownership, as of December 1943 (the last available report on this subject before the Japanese surrender, as well as of 31 December 1945 and 31 December 1946. The decline in the percentage of households which rent all the land they cultivated from 51% of the total in 1943 to 43% in December 1946, is explained largely on the basis of the following factors:
The reduction in legal rentals for farm land to a maximum of
--- p414 ---
one-third of the principal crops, put into effect in October
1945, sharply reduced the income received from the land by the
landlords, and therefore usually made them more willing to
sell their land to tenants.
Since the end of the war the subject of land reform has been
widely discussed and it is generally considered to be only a
matter of time before some type of land reform is put into
effect in.South Korea. These factors coupled with the
the confiscation without payment of the land of landlords in
North Korea in March 1946, has tended to keep the price of
farm land low in relation to other prices, and has thus
enabled many tenant farmers, whose economic status was raised
by the reduction in maximum rental payments, to purchase the
farms they till. Although no statistics for 1947 are yet
available, the same trend toward the sale of farms by land-
lords to tenants noted in 1946 was undoubtedly continued
during 1947.
Table 2 gives the number of farm households in South Korea as
of 31 December 1946 including type of tenure, by provinces. Table 3,
giving the number of farm households by size of farm, as of
31 December 1946, reveals a significant trend toward subdivision of
the larger farms into smaller units and an increase in the number of
the very small farms. Thus the number of farms of over 24.5 acres
decreased 40.1% during the calendar year 1946, the number whose size
ranged from 12.5 to 25 acres decreased 33.2%, the number whose size
was from about 7.4 to 12.5 acres decreased 25.9%, and the number
whose size was from 4.9 to 7.4 acres decreased 16.9%. During the
same year, 1946, the number of farms of less than 1.22 acres increased
7%, while the number whose size ranged from 1.22 to 2.451 acres
increased 9.6%. These developments are attributed largely to the
increased pressure for land resulting from the arrival of over two
million Korean repatriates from Japan and China and refugees from
northern Korea during the latter part of 1945 and 1946. This trend
toward reduced size of farms, which at present averages only about
2.7 acres per farm in South Korea, tends to reduce the proportion of
agricultural production available for sale to the government for
rationing to non-self-suppliers, and thus to accentuate the food
problem.
Table 4 indicates that of the 2,136,925 farm households in
South Korea, as of 31 December 1946, only 1n3 were non-Korean. Over
89% of the total farm households reported farming as their sole
occupation. Most of the 231,631 households which farmed only part
time also engaged in fishing to supplement their agricultural income.
2 - Possible Effect of Land Reform Proposals now Under Consideration
Upon Pattern of Farm Land Ownership in South Korea:
If the South Korea Interim Legislature should approve the
--- p415 ---
Land Reform Bill presented for its consideration and approval by its Agriculture, Industry, and Labor Committee, it is estimated that about 90% of the farmers in South Korea would hold title to the land they farm within one year after passage of the bill. This bill. would enable tenant farmers to purchase the farms they now cultivate from absentee landlords for annual payments of 20% of production for a period of 15 years. However, because the strong rightist bloc in the Legislature desires to withhold consideration of this bill until a Korean Government is established, it now appears unlikely that the present Legislature will approve a land reform bill which includes disposition of both former Japanese-owned and Korean-owned agricultural lands.
If the present Legislature fails to approve a land reform bill involving disposition of both former Japanese and Korean-owned agricultural lands, it is planned that vested former Japanese-owned agricultural lands will be sold to tenant farmers during the spring of 1948, either with Legislative approval or by executive decree. Regular reports on the progress of the land reform proposals will continue to be sent to the Department by radio.
Tables 5 and 6 are presented to show the present agricultural land holdings of the New Korea Company, the agency designated by the Military Governor to administer former Japanese-owned agricultural lands. As shown in Table 5, the total agricultural land administered by the New Korea Company as of December 1947, totalled 696,545 acres (284,188 chongbo). This represents over 90% of the known former Japanese-owned agricultural land in South Korea; various other government agencies still administer minor holdings of vested farm lands. Table 6 shows that the total number of farm households now renting farm land from the New Korea Company as of June 1947 totalled 554,067, of whom 33,393 were part time farmers. At that time the average New Korea Company land rented per farm household was only 1.1 acres (4.5 tanbo or .45 chongbo). This former Japanese-owned land includes much of the best rice land in South Korea. Although these plots are below the average size farm, many New Korea tenants either rent additional farm land from Korean landlords, or own small plots in addition to the farms they rent. The total number of persons living on New Korea Company administered lands, as of June 1947, was 3,127,347, about 15% of the total population of South Korea. It is generally believed that if the tenants on New Korea administered land are given the opportunity to purchase their farms on favorable terms, increased pressure will be exerted by tenants of Korean-owned farms to secure the same opportunity of purchasing their farms
Respectfully yours,
ARTHUR C, BUNCE
Minister
--- p416 ---
encls: 6 Tables
Original & Ozalid to The Department
c.c. Con.Gen.Files
<첨부문서> 남한의 농지소유 현황(표6)
Table 2
NUMBER OF FARM HOUSEHOLDS IN SOUTH KOREA, BY TENANCY,
as of 31 December 1946
Province Owner-Farmer 50-100% Owner-Farmer Less than 50% Owner-Farmer Tenant Others TOTALS
Seoul 90 157 220 2,361 56 2,884
Kyonggi 23,836 38,478 44,252 160,725 12,495 279,786
N.Chungchong 17,374 24,901 31,164 63,096 1,186 137,721
S. Chungchong 19,996 33,388 43,129 126,431 4,871 227,815
N. Cholla 14,092 29,089 43,228 156,236 25,638 268,283
S. Cholla 52,661 69,099 34,881 163,992 17,171 377,804
N. Kyongsang 66,838 79,322 80,810 123,734 4,231 354,935
S. Kyongsang 52,661 80,177 78,502 81,366 --- 322,706
Kangwon 28,823 26,720 23,976 43,059 356 122,934
Cheju 30,900 5,574 3,114 2,686 146 42,420
TOTAL 1946 337,271 386,905 423,276 923,686 66,150 2,137,288
TOTAL 1945 284,509 337,506 376,574 1,009,604 55,284 2,065,477
% Increase or Decrease
1946 over
1945 18.6% 14.6% 11.8% - 8.5% 19.7% 3.5%
Note: One household equals fivepersons.
Source: Statistics Section, Bureau of Agricultural Economics,
Department of Agriculture.
--- p417 ---
Table 3
NUMBER OF FARM HOUSEHOLDS IN SOUTH KOREA, BY SIZE OF FARM,
as of 31 December 1946
| Province | Less than 5 Tan * | 5 Tan to 1 Chungbo* | 1 to 2 Chungbo | 2 to 3 Chungbo | 3 to 5 Chungbo | 5 to 10 Chungbo | Over 10 Chungbo | Sub-total | Non-Farming x | TOTALS |
|---|---|---|---|---|---|---|---|---|---|---|
| Seoul | 735 | 1,440 | 427 | 167 | 79 | 2 | — | 2,850 | 34 | 2,884 |
| Kyonggi | 59,717 | 84,647 | 83,093 | 38,178 | 10,817 | 710 | 11 | 274,073 | 5,713 | 279,786 |
| N. Chungchong | 57,044 | 46,231 | 25,701 | 6,344 | 1,261 | 93 | 6 | 136,680 | 1,041 | 137,721 |
| S. Chungchong | 80,978 | 79,446 | 46,243 | 12,870 | 2,793 | 591 | 23 | 222,944 | 4,871 | 227,815 |
| N. Cholla | 94,414 | 84,947 | 48,702 | 11,892 | 2,417 | 318 | 24 | 242,714 | 25,569 | 268,283 |
| S. Cholla | 163,560 | 115,887 | 60,714 | 17,322 | 4,747 | 1,143 | 26 | 363,369 | 14,435 | 377,804 |
| N. Kyongsang | 106,558 | 124,454 | 92,689 | 21,728 | 4,950 | 310 | 15 | 350,704 | 4,231 | 354,935 |
| S. Kyongsang | 110,234 | 141,662 | 58,930 | 10,820 | 854 | 206 | — | 322,706 | --- | 322,706 |
| Kangwon | 35,253 | 41,208 | 32,170 | 11,232 | 2,531 | 146 | 38 | 122,578 | 356 | 122,934 |
| Cheju | 15,377 | 15,588 | 8,665 | 1,930 | 627 | 87 | 2 | 42,276 | 144 | 42,420 |
| TOTAL 1946 | 723,870 | 735,510 | 458,234 | 128,483 | 31,046 | 3,606 | 145 | 2,080,894 | 56,394 | 2,137,288 |
| TOTAL 1945 | 676,805 | 671,186 | 459,443 | 154,571 | 41,451 | 5,399 | 242 | 2,009,077 | 56,400 | 2,065,477 |
| % Increase or Decrease 1946 over 1945 | 7.0% | 9.6% | -.- .3% | - 16.9% | - 25.1% | - 33.2% | - 40.1% | 3.6% | 100.0% | 3.5% |
* One Tan equals .2451 acres; one Chungbo equals 2,451 acres.
x Non-farming households are those which are considered farmers but are not presently raising crops on their land.
Note: One farm household equals five persons.
Source: Statistics Section, Bureau Agricultural Economics, Department of Agriculture.
--- p418 ---
Table 4
NUMBER OF FARM HOUSEHOLDS IN SOUTH KOREA, BY NATIONALITY,
as of 31 December 1946
Province Koreans Chinese Others Solely Farming Households Part-time Farming Households TOTALS
Seoul 2,846 38 -- 2,221 663 2,884
Kyonggi 277,570 215 1 256,425 23,361 279,786
N. Chungchong 127,707 14 -- 125,856 11,865 137,721
S. Chungchong 227,791 24 — 209,064 18,751 227,815
N. Cholla 262,245 38 -- 230,192 38,091 268,283
S. Cholla 377,788 16 -- 328,853 48,951 377,804
N. Kyongsang 354,919 15 1 329,389 25,546 354,935
S. Kyongsang 322,706 -- -- 279,704 43,002 322,706
Kangwon 122,933 1 -- 105,018 17,916 122,934
Cheju 42,420 -- -- 38,884 3,536 42,420
TOTAL 1946 2,136,925 361 2 1,905,657 231,531 2,137,283
TOTAL 1945 2,065,105 362 10 ----- ----- 2,065,477
Note: One Farm Household equals five persons.
Source: Statistics Section, Bureau Agricultural Economics,
Department of Agriculture.
--- p419 ---
Table 5
DISTRIBUTION OF LAND AREAS ADMINISTERED BY NEW KOREA COMPANY
as of end of December 1947
(areas in Chungbo *)
Provinces Paddy Area Dry Area Agricultural Land Areas Lot Areas Other Areas TOTAL Agric. Area Forest Area TOTAL All Land Areas
Kyonggi 23,634 9,658 650 1,597 35,539 19,267 54,806
Kangwon 819 1,055 88 16 1,978 15,598 17,576
N. Chungchong 4,927 4,083 427 415 9,852 2,832 12,684
S. Chungchong 24,385 7,543 774 2,219 34,921 --- 34,921
M. Kyongsang 13,483 8,917 370 463 23,233 --- 23,233
S. Kyongsang 26,084 7,741 452 2,801 37,078 --- 37,078
N. Cholla 56,752 7,720 404 370 65,246 --- 65,246
S. Cholla 55,068 18,303 102 1,905 75,379 --- 75,379
Cheju 17 920 2 23 962 --- 962
TOTAL 205,169 65,940 3,269 9,810 284,188 37,697 321,885
* One Chungbo equals 2,451 acres.
Source: Land records of New Korea Company.
--- p420 ---
Table 6
TENANT FARMERS TILLING FARM LANDS OF NEW KOREA COMPANY
(as of June 1947)
Number of Tenants Average Number of Persons on Farms Average
Provinces Full-time Farmers Part-time Farmers TOTAL Area per Tenant (Tan*) Male Female TOTAL Number of Persons per Family
Kyonggi 36,878 8,131 45,009 5.9 143,168 138,720 281,888 6.2
Kangwon 4,286 861 5,147 3.6 16,132 15,251 31,383 6.0
N. Chungchong 23,788 1,252 25,040 3.6 75,638 69,188 144,826 5.9
S. Chungchong 68,152 4,119 72,271 4.4 194,492 183,045 377,537 5.2
N. Kyongsang 47,990 1,969 49,959 4.1 168,146 153,922 322,068 6.5
S. Kyongsang 74,129 6,142 80,271 3.8 255,812 238,421 494,233 6.1
N. Cholla 98,885 5,185 104,070 5.9 315,581 303,997 619,578 6.0
S. Cholla 166,351 5,772 172,123 4.1 434,807 419,936 854,743 5.0
Cheju 166 11 177 3.4 499 592 1,091 6.1
TOTAL 520,674 33,393 554,067 4.5 1,604,275 1,523,072 3,127,347 5.6
* One Tan equals .2451 acres, or one-tenth of a Chungbo. This area of New Korea Company land rented by each household, and does not include the lands tilled by the farm households which are either owned by them or rented from Korean landlords.
Source: Tenant Survey of New Korea Company, 1947.
출처:
제주4·3사건진상규명및희생자명예회복위원회 편,
『제주4·3사건자료집 9』 [미국자료편],
번역문 p.86
/ 원문 p.403–410 / No. 39.